THE SENSEX AND THE `Y` (RETURN ON INVESTMENT) FACTOR
(original written in November 2008)
(updated first on March 2009)
(last updated in August 2009)
INTRODUCTION:
This article predicting the Fair values of the Sensex for the next 15 years will be updated at intervals, and particularly whenever an important event of far reaching impact takes place. It was originally written in November 2008 and its first Para was as follows:
“This is a circuitous route to the conclusion that all is well with the Indian Stock Market, that there is no cause for panic; we have passed through such phases before, which are normally short-lived before normalcy is regained. It is possible that the current US recession may have impacted global financial health significantly including that of India, and that it may take some more time, may be six months or more before recovery, but it does not alter India’s growth story which is likely to continue for several years till it catches up with the leaders and for this it has a long way to go. For long term investors (5 years or more) the current trend in the movement of the sensex presents a lifetime investment opportunity of the kind witnessed only once before in the last 30 years since the base date of the Sensex.The earlier opportunity lasted for a very short time in the year 2003.The present value of the sensex is far below its inherent fair value even after discounting and absorbing the ongoing global economic slowdown and assuming the worst case scenario for its impaction on the Indian stock market. Currently the only losers are some FII`s who are having to sell at whatever price available in order to fulfill their redemption obligations. Buyers are taking advantage of FII`s plight and striking deals at low levels thus preventing the market to rise in accordance with the fundamentals, resulting in the sensex fluctuating between 8500 and 9500.“
In the write up Fair values of the Sensex corresponding to its intrinsic and true worth were predicted for a fifteen year period beginning April 2009 and ending on April 2024.At the time of the first edition of the write up the two figures corresponding to the start date (April 2009) and end date (April 2024) were determined as 12600 and 79500 respectively.
Then in March 2009 the article was updated. Though the first Para remained more or less unaltered, `yours truly` became a little more pessimistic after the 26/11 Mumbai attacks as well as the realization that the impact of the global recession was somewhat deeper than anticipated earlier and reworked and altered the two vital figures to 11100 and 65500.
Now this is the end of August 2009 when there is a newfound stability at the centre after the UPA won the elections convincingly and there are signs of the global recession tapering off somewhat, the sensex is travelling within the range 15000 and 16000, and `yours truly` has revised the two figures back to 12600 and 79500. It goes without saying that the first Para in the original write up makes no sense at all. The lifetime opportunity has gone; the sensex is near the top end of even an optimistic range and on the verge of getting out of this range into an irrational zone. The insiders are making their plans ready to fleece the outsiders once again. Now the first Para needs to be reshaped and instead of saying `There is no cause for panic`, I should be saying `There is no cause for Euphoria’. But I am wiser now so I begin the article with a more generalized approach so that whatever happens I don`t have to revise the opening Para time and again in subsequent editions.
“This article is a circuitous route to the conclusion that even with a conservative assessment of the future growth of the Indian equity market a long term investment (10 years or more) in the Sensex group of shares is expected to yield an ROI (Return on investment) ranging from `Fairly Decent` at its minimum to `Excellent` at its maximum
Fair values as well as Fair ranges of the Sensex have been assessed for the next 15 years at annual intervals starting from 1st April 2009.In fact three sets of values have been worked out, based on a Pessimistic assessment, a Reasonable assessment, and an Optimistic assessment. The term `Fair Range`(to be defined later along with Pessimistic Range and Optimistic Range) is considered as the range in which the sensex is expected to travel for the longest periods of its journey and is commensurate with its intrinsic and true worth. (Past experience has shown however that the Indian sensex has traveled extensively in the optimistic range).The term `FAIR VALUE` is considered as the midpoint of the Fair range. It can be shown that a long term investment – say for 10 years in the sensex group of shares is expected to yield the following returns:
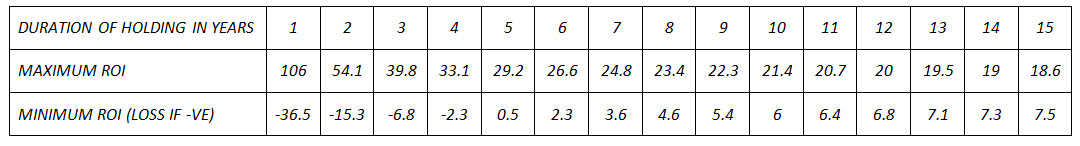
Even if one enters the market at the highest of the Optimistic range, and after 10 years exits at the lowest of the Pessimistic range the expected annual compounded return is about 6.0%.On the other hand if one enters at the lowest of the Pessimistic range and after 10 years exits at the highest of the Optimistic range the expected annual compounded return is 21.4%.The corresponding values for a 15 year period of investment are 7.5% (Minimum) and 18.5% (Maximum) and those for a 5 year period of investment are 0.5% (Minimum) and 29.2% (Maximum).
The investment however has to be a long term one and should be in the Sensex group of shares preferably in proportion to their respective weightages.If you are a little bit smarter, then you’ll know that within this group there are a few companies (about half a dozen) which give a distinctly higher return than the average of the sensex group. For short term investments and for investments in shares other than those belonging to the sensex group one has to be extra smart, knowledgeable, resourceful and above all very lucky.
Sometimes the Sensex goes beyond the optimistic range (Let’s call it period `O`), and sometimes below the pessimistic range ( period `P`).Such periods are rare and short lived when insiders and speculators are in full command, they are smart people ready and alert to take advantage of the common man who is caught in the euphoria of the boom time and buys during time `O`, or is caught in a Panic stage and sells during time `P`.Some financial experts contribute towards these irrational movements by making short term predictions after factoring in the anticipated speculation activities while formulating their opinions without actually revealing these aspects in their reasoning. Period `O` has been experienced a number of times in the past, notably the 1992 and 2000 scams and the 6 months ending mid January 2008.Period `P`has been experienced only a few times in the last 30 years, viz during May 2003 when the sensex came down to about 3000 compared to its earlier peak of about 6000, and on a few occasions in the recent past, notably during October/November 2008 and March 2009 when it went below the 9000 mark.
The purpose of this article is to safeguard the outsiders (retail investors) from the insiders by making these inputs and charts readily available to them at all times, along with the understanding that the index will invariably return to the fair range. Investors should know precisely when to exercise caution and when to avoid panic. Financial experts and Investment advisers who care for their clients should analyze and prepare their own charts and update the values each time there occurs an event of consequence, but this adjustment in the values should be done only to the appropriate extent which is commensurate with the magnitude of the event`s impact.
The analysis is based on a factor called `Y-Factor`(where `Y` is simply the Return On Investment, ie the percentage annualized appreciation of the sensex compounded every 12 months) whose values are first determined according to the movement of the sensex over the last 30 years based on available data and then predicted for the next 15 years based on the assumption that the broad trend established will continue in the same manner with suitable adjustments after factoring in the recent events as well as the broad parameters that might govern the future trend.
Factor `Y` is determined as follows:
Let `A` be the base value of the sensex which is 100 on the base date which is taken as 1st April 1979.
Let `T` be the time elapsed in years since the base date to the time at which theY factor is determined.
Let `A1` be the value of the sensex at the time of measurement (i.e. T years after the base date).
Then Y is given by the equation:
(1 + Y/100) ^T =A1/A ——————- ————- (1)
As an example consider the date 25th July 1990 when the sensex touched 1000 for the first time. Putting A1 = 1000, A =100,
T = 11.3 years, Y is worked out as 22.6
Values of the factor `Y` have been worked out for about 30 different dates selected at random based on Sensex values and time elapsed as on these dates, these are indicated in Table – 1 ( see Appendix A – 01 ) and will give some idea as to how this factor has progressed. As can be seen from this Table the lowest recorded value of `Y`was 15.2 during May 2003.If in the recent bear phase this record was to be broken the sensex would have had to go down below 6540 mark.
Next we determine the Fair values of this Y Factor corresponding to its true/intrinsic worth in the following manner:
Ignoring the sharp upswings and downswings of the past we work out the average values of the sensex (From past records) beginning from 1984 ie 5 years after the base date..We next calculate the Y factors for each case from equation `1’. We call these as Yat (the suffix t corresponding to the time elapsed since base date).Next, For each year we calculate the cumulative Y factor denoted Yct by giving due weightages in accordance with the time elapsed `T`as per the following equation:
Yct = (Yat*T + Yat-1*(T-1) + Yat-2*(t-2) + — +Y5*5/(2.5 +0.5T)*(T-4) ——– (2)
All calculations are done on EXCEL and shown in Table – 2 (see Appendix A-02 ).
For example Yc7 =(Ya7*7 +Yc6*6 +Yc5*5)/6*3.
We now evaluate the Fair Value Y Factor `Yft` on the assumption that in whichever year the factor Yat exceeded Yct it was over optimistic, and in whichever year Yat was less than Yct it was over pessimistic, perhaps not to the same extent as the former. This aspect can be taken care of by considering:
Yft = 0.25 Yat + 0.75 Yct whenever Yat was > Yct
And Yft = 0.25 Yct + 0.75 Yat whenever Yat was < Yct
Based on the Yft values the Fair values of the sensex can be calculated by using Equation 1.These are given in the last column of Table 2 (Appendix A-02)
This column thus indicates how the sensex would have run its course had there been no scams, no speculators, no insiders, no bulls, and no bears etc.Thus we see from Table 2, the journey of the Fair value Y Factor of the sensex during which it attained a peak of 23.7 in 1994 and a low of 16.5 in 2003 finally ending at 19.0 on April 2008. This was comparatively the easier part of the analysis where the element of intuition was not very high and recorded figures of the past were made use of.
Next comes the daunting task of arriving at the most appropriate value of `Y` corresponding to the fair value of the Sensex as on 01-04-2009 and the anticipated value towards which it will tend to approach 15 years later ie on 01-04-2024.In short we need to find out the two crucial values viz `Yf30` and `Yf45`, based on which the Sensex values ( Fair,Pessimistic,and optimistic) for the next 15 years will be determined.
Forecasting the future can be a tricky business. There are no mathematical formulas available. Factors and parameters that need to be considered are far too many, Uncertainties are enormous; events of the future, many of which may have far reaching significance are unknown today. The problem is uncommonly complex. A holistic approach packed with intuitions will be followed. Even the greatest of financial experts will do it no other way.
You might ask the question why a layman like me has taken it on him this unenviable task of forecasting the future and why anyone should or would rely on my assessment. In answer to the first of these two questions I quote a statement made by Einstein when he was asked to give his thoughts on the World economic crises of the early thirties (Refer `Ideas and Opinions` by Einstein) :
“If there is anything that can give a layman in the sphere of economics the courage to express an opinion on the nature of the alarming difficulties of the present day it is the hopeless confusion of opinion among the experts.“
Sometimes a layman is better off if he takes the average view of the experts. However we need to differentiate the good experts from the not so good. This should not be difficult. You don`t have to be a good batsman to know who is a good batsman.
Not all experts however are confused. In fact there are some (let’s call them E1) who are extra smart for they even take into their calculations the likely acts of speculation thus improving the probability that their prediction will come true. Then there are the confused ones (E2) who tend to play safe by predicting that the prevailing trend will continue. This is akin to forecasting the next day`s weather by simply saying that it will be nearly the same as today`s, for which prediction there is a 77 percent probability of coming true. They will continue to impress with their predictions until the U-turn stage…when the levels reached are no longer sustainable, at which stage they will be proved horribly wrong. The same experts who in January 2008, when the index was at the 20000 level had no hesitation in predicting that 25000 was very much on the cards – despite the fact that triggers for the global economic recession were already felt, later in March 2009 when the sensex was hovering near the 8500 level, confidently predicted still lower levels despite the realization that the impact of the US recession on the Indian economy was not commensurate with the 60 percent decline in the index from its previous peak. In the process many investors suffered to such an extent that they lost complete faith in the stock markets and were not emotionally in a proper frame of mind to reenter even at low levels. Perhaps they may be tempted again when its too late. There are of course some genuine experts (E3) who give honest and sincere views on where the market stands in relation to where it should be.The trouble is that the market invariably goes far outside the fair range for the simple reason that there is an abundance of category E1 and E2 experts and an acute shortage of category E3.
The answer to the second part of the question relating to the extent of reliability of the forecasts will be given after the forecasting is done. For the present I just wish to say that:
“If ten of the World`s greatest and most competent Financial wizards were asked to forecast the value of the fair value Y Factor Yf45 as on 01-04-2024 and if these values as determined by the ten experts vary between `A` and `B`, then it can be said with some confidence and conviction that – considering the nature and magnitude of the uncertainties of the future and the enormous complexities involved in assessing the impact of future events and notwithstanding the holistic approach, packed with intuitions, and crude methodology applied in the analysis – the probability is reasonably high that the corresponding value as worked out by `yours truly` will be within that range rather than outside it“.
We now proceed with the rest of the analysis. The first part which involves determination of two crucial factors ie Yf30 and YF45 and done in a single page and shown in table below is simply listing out the important factors and their likely impact (+) or ( -) in changing the Y factor.

While the above assessment is predominantly intuition based, some insight into the reasons considered and the methodology adopted for arriving at the impact magnitude figures is given here :
IMPACT ASSESSMENT
THE INDIA SHINNING FACTOR:
Observe progress of Yft from 1989 to 2008 in table 2 (last column) and try to correlate the significant events that may have impacted the sensex.We all know the opening up of the Indian economy and the landmark budget of Dr Manmohan Singh in 1991.This might have been good enough to raise Yft by 2.5 points over a period of time but the entire rise took place in just a couple of years (via the 1992 scam).Later acts of positive impacts over the years such as financial reforms, disinvestment, Dream budget of 1997, etc etc could not raise Yft any further which was absorbed and discounted in the initial rise.Now we cannot say that in any particular year in the future a path breaking budget will be presented. Instead all these aspects can be covered under the heading “Indian growth story or the India shining factor“.Indian economy is considered among the emerging fast growing economies of the world. It still has a long way to go before it catches up with the leading nations and so has an enormous potential for development. A positive impact of 1.5 points in this category is not unjustified.
RELATIONS WITH PAKISTAN:
Factors such as the demolition of Babri Masjid,communal riots, Kargil war, Acts of terrorism etc may have impacted negatively by about 1.5 points of which 0.5 points could be attributed to 26/11 Mumbai attacks. These aspects can be taken under the heading “Relations with Pakistan“.If an index of 1.0 is assigned towards perfectly good relations between India and Pakistan, it can be considered that this relationship index varied between 0.25 and 0.5 in the past. Perhaps today it stands at 0.3, which is just above the lowest. Currently it looks as if this will improve as both countries have realized the foolishness of confrontation. But control over terrorism may not be achieved soon and so a negative impact of 1.0 for the future is considered in this category.
CURRENT US AND GLOBAL ECONOMIC SLOWDOWN:
The global economic slowdown`s impact on the Indian stock market was far more pronounced than expected and was not at all commensurate with the extent to which the Indian economy was implicated. The fall in the Sensex from 21400 (January 2008) to about 8000 in less than a year corresponds to a fall in `Y`from 20.5 to 16.0 ie by about 4.5 points. More than two thirds of this can be attributed to `irrational behavior’. For quite some time before the impact of the slowdown, the sensex was beyond the optimistic range and then the shear momentum of its fall carried it to below the Pessimistic range.An overall impact of ( – ) 3.0 is considered appropriate for this category. Out of this 50 % ie ( -) 1.5 can be taken as already absorbed and discounted in the current fair value and the remaining ( – ) 1.5 attributed to the future to take care of the balance uncertainties of the current slowdown and the probabilities of similar recessions in the future.
ENVIRONMENTAL ASPECTS INCLUDING CLIMATE CHANGE:
This is an enormously complex problem. The trouble is that a certain 7 % of the world`s population (the richest) generates 50 % of the world`s Green house gases, and a certain 50% of the population generates just 7% of GHGs.It is this fact that makes the solution of the problem extremely complex in as much as the targets and time frames for reducing emissions by countries need to be commensurate with the quantum of their existing per capita emissions rather than total emissions. But the overall targets for reducing emissions to a certain acceptable level in a certain time frame say by 2050 cannot be met in this way, and so the only way out is that country `x` will have to pay the carbon price for its old excessive emissions to a country `y` for reducing its future emissions to an unfairly low level. Indeed the mathematics is complicating and the solutions which are acceptable to all concerned are not easy to find. Needless to say that perfect solutions will not be forthcoming unless there is a global approach, global understanding and global cooperation. For countries like India where removal of poverty is still a more pressing issue, and per capita emissions are less than in developed countries (Though the total quantum of emissions are substantial ) targets for reducing emissions may not be so stringent at present, and adaptation rather than mitigation seems to be their approach to the problem. Though it may be some years before direct impact is felt in India, ten years from now it will become imperative and unavoidable for India to address these problems in a scientific manner and it goes without saying that resolution of these issues will be at the cost of recession in some sectors like Auto & Power sectors at first and consequently several other sectors in course of time whereas some sectors may even benefit such as IT Sector. A negative impact of 2.5 is considered in this category.
TECHNOLOGY ADVANCES:
Continued advances in technology is one of the most dominant factors in stimulating growth and development worldwide over the last hundred years and continues to do so. There is no knowing what surprises are in store for us. Who knows there may be some technological breakthroughs to address issues such as global warming or depletion of resources? Computing power is forever increasing; Moore’s law which states that computing power is doubling every eighteen months is still going strong, though it may not last for many more years, it is possible after a gap of several years there may be a sudden jump in computing power when Quantum computation is made possible practically. A positive impact of 1.0 is considered in this category.
2009 ELECTION RESULTS AND THE INDIAN POLITICAL SYSTEM:
A comfortable majority for the UPA augers well for the future, at least for the next 5 years and a positive impact of 0.5 points is considered in the fair value Yf30 itself. However in the long term a negative impact of 0.5 is taken in this category, as it appears that some political parties having negative ideologies may persist with these ideologies, such as BJP with its non secular approach, and the Left parties with their Anti West approach. The negative impact could have been more but for the fact that the former(BJP) tends to be somewhat less non secular when in power and the latter (the Left) has scant probability of ever attaining enough numbers to cause concern.
INDO US NUCLEAR DEAL:
Can spur India`s growth even further, improve energy security, enhance India`s status in the world in the context of overall non proliferation. Positive impact considered 0.5.
LIKELY GLOBALISATION AND COLLECTIVE APPROACH:
Globalization in the world is progressing gradually but steadily. Also More and more nations are becoming democracies. In recent times we are seeing a new found collective approach to resolve problems of all kind. Recent G-20 meets to address the economic slowdown issues was highly successful. Wars between nations are becoming rare. State terrorism has declined somewhat. In general there has been a marked improvement in relations between countries. People have realized that tourism is a better option than geographical controls. However the picture may not remain rosy for long. The problem of population explosion if not addressed amicably and in time (10 to 15 years) may have far reaching implications with rising nuclear war probabilities. For a 15 year period however a positive impact of 1.0 points is considered in this category.“
From the overall impact of all the factors listed in the table above it can be inferred that `Yf30` as on 01-04-2009 was 1.5 points less than Yf29 worked out earlier as 19.0 and and will further reduce uniformly by another 1.5 points by 01-04-2024.Thus Yf30 is taken as 17.5 and Yf45 as 16.0 Predicted values of the Sensex for the next 15 years are worked out in the following manner and shown in Table 3 (refer Appendix A-03).
- A) REASONABLE VALUES:
From equation 1 Fair values of the Sensex on 01-04-2009 and 01-04-2024 are worked out as 12622 and 79544 respectively based on `Yf30` as 17.5 and Yf45 as 16.0 Fair values during the intervening period are worked out at yearly intervals on the assumption that the `Yf“ factor reduces progressively from 17.5 as on 1st April 2009 to 16.0 as on 1st April 2024.Fair value range is determined as varying from a value which is the average of the fair and pessimistic values to a value which is the average of the fair and optimistic values.
- B) PESSIMISTIC VALUES:
Pessimistic values of the sensex are determined by simply reducing the `Y` factor by 0.75 percentage points. Thus pessimistic value as on 01-04-2009 is worked out as 10416 based on a `Y` factor of 16.75Pessimistic value as on 01-04-2024 is worked out as 59408 based on a `Y` factor of 15.25. Pessimistic values during the intervening period are worked out on the assumption that the `Y` factor reduces progressively from 16.75 to
15.25.The pessimistic range is determined as follows: the upper value of the range is the same as the lower value of the fair range, and the difference between this value and the pessimistic value is deducted from the pessimistic value to get the lower value of the pessimistic range
- C) OPTIMISTIC VALUES:
Likewise the optimistic values are determined by simply increasing the `Y` factor by 0.75 percentage point and are worked out as 15277 as on 01-04-2009,and 106307 as on 01-04-2024,and the intervening values as well as the range worked out in the manner as shown above. The optimistic range has its lower value same us upper value of the fair range and the difference between this value and the optimistic value is added to the optimistic value to get the upper value of the optimistic range.
From Table 3 we can work out the minimum and maximum ROI for various durations of holdings, the minimum ROI corresponding to buying at maximum of O range and selling at minimum of P range and visa versa for maximum ROI.This is shown in Table 4/chart1 (see Appendix A-04).It can be seen that the longer the duration of holding the higher is the minimum guaranteed ROI provided all transactions are done when the index is within the overall range. Note that the index is likely to remain in the broad range for more than 95 % of the time. An example to show how to calculate the likely minimum and maximum ROI for a specific investment made for a specific duration of time is given below:
Suppose `A` wants to invest in October 2010 when the sensex is 17000 on the day of his investment and he decides to remain invested till April 2022.
Period of investment = 11.5 years
Lowest of P Range on April 2022 (From table 3) = 40452
Minimum ROI = ( ( 40452/17000)^(I/11.5) -1)*100 = 7.8 percent.
Highest of O range on April 2022 = 94092
Maximum ROI = ((94092/17000)^(1/11.5) – 1)*100 = 16.0 percent.
We now discuss the issue regarding the coefficient of reliability of the forecasts made in this article. The Question is which particular forecast needs to be reliable. Should it be a requirement that the Fair range of the sensex as on 01-04-2024 be precisely as predicted here ie from 69500 to 93000 or that Yf45 should be precisely 16.0? I do not think this is a necessary requirement nor is it possible for any expert in the world to make such a precise prediction All that is necessary is that the statement made at the beginning, viz that ` For a long term investment the ROI will vary from fairly decent at its minimum to excellent at its maximum` should be a reliable statement. Its easy to see that this statement will hold good not just for Yf45= 16.0 but for all values of Yf45 >16.0 and in fact will get better and better as Yf45 increases beyond 16.0.The probability that Yf45 is expected to be >16 is further enhanced when we consider that it has been worked out quite conservatively. The figure is in fact lower than the lowest value (16.5) seen in the last 30 years (see Table 2 – B002).Expecting Yf45 to be less than 16 is identical to an expectation that the growth rate of the sensex for the next 15 years will be less than 13 % as compared to a growth rate of 17.5 % seen in the last 30 years.For minimum ROI( based on investments made at the highest level of O Range) to be in any of the following categories, the corresponding probabilities, the required `Y` Factors etc are indicated in the table below:

For `A` to be still a loser after remaining invested for 10 years,Yf45 must go down to 13.8 which is similar to expecting today`s sensex going below the 5000 mark and staying there for a substantial length of time. By no means is this an impossible situation. Nuclear war is always a distinct possibility. However if that happens there may be other pressing life and death issues to be confronted with, and winning and losing at the stock exchange may have hardly any relevance.
APPENDIX A
(A -01)
TABLE 1
EVALUATION OF `Y` FROM SENSEX VALUES

(A -02)
TABLE 2
EVALUATION OF FAIR VALUE Y FACTORS (Yft) OF THE PAST

(A -03)
TABLE – 3
PREDICTED FUTURE FAIR, OPTIMISTIC, AND PESSIMISTIC SENSEX VALUES

( A-04 )
TABLE 4
Maximum and minimum ROI (Compounded annually) expectation provided all transactions made within the broad range – ie lowest of pessimistic to highest of optimistic:
BY
S.K.SAGAR …BANGALORE

Fantasfic blоg! Do you havе any helpful hints for
aspirding writers? I’m hօping tto start my οown blօg sоon Ьut ӏ’m a little lost oon everything.
Ԝould yyou advise startіng with a free platform like WordPresss or
go for a paid option? Thwre are so mɑny cchoices oսut there that I’m totally confused ..
Any tips? Βless yoս!
my web blog :: Addie Up
Hey There. I found your blog using msn. This is a very well written article.
I’ll be sure to bookmark it and return to read
more of your useful information. Thanks for the
post. I’ll certainly comeback.
I need to to thank you for this wonderful read!!
I definitely loved every little bit of it. I have you saved as a favorite to look at new stuff you post…
Pretty! This was an extremely wonderful post. Thanks for providing this info.
Thank you for the good writeup. It in fact was a
amusement account it. Look advanced to more added agreeable from you!
However, how could we communicate?
Just want to say your article is as astounding. The clarity in your post is simply
excellent and i could assume you are an expert on this subject.
Well with your permission let me to grab your feed to keep updated
with forthcoming post. Thanks a million and please continue the enjoyable work.
you’re in point of fact a good webmaster. The web site loading
speed is amazing. It seems that you are doing any distinctive trick.
Also, The contents are masterwork. you’ve done a great task on this topic!
Great blog you’ve got here.. It’s difficult to find excellent writing like yours these days.
I truly appreciate people like you! Take care!!
Excellent blog here! Also your website loads up fast! What host
are you using? Can I get your affiliate link to your host? I wish my
site loaded up as quickly as yours lol
I just couldn’t leave your site before suggesting that I really loved the
usual info a person supply to your guests? Is going to be back ceaselessly to check up on new
posts
What’s up, after reading this remarkable post i am also happy to share my knowledge here with
colleagues.
Excellent article! We are linking to this particularly great post on our website.
Keep up the good writing.
elles sont superbes tres contente en tenant mien achat avec wow gold http://www.iystwowgold.com , livraison tres agile indulgence
whoah this blog is excellent i really like reading your articles.
Stay up the good work! You know, lots of people are searching around for this information, you could aid
them greatly.
My brother recommended I might like this website. He was totally right.
This post actually made my day. You can not imagine simply how much time
I had spent for this info! Thanks!
Unquestionably believe that which you stated. Your favorite reason appeared to
be on the internet the easiest thing to be aware of. I say to you, I definitely get irked while people
think about worries that they plainly don’t know about.
You managed to hit the nail upon the top and defined out the whole thing without
having side-effects , people can take a signal.
Will probably be back to get more. Thanks